Monitoring EC2 Instance using Prometheus and Grafana
D
Hi there! I'm Dinesh, a passionate Cloud and DevOps enthusiast. I love to dive into the latest new technologies and sharing my journey through blog.
Search for a command to run...
Hi there! I'm Dinesh, a passionate Cloud and DevOps enthusiast. I love to dive into the latest new technologies and sharing my journey through blog.
No comments yet. Be the first to comment.
1. Difference between Docker and Kubernetes Docker → Builds and runs containers.Kubernetes → Orchestrates containers across multiple nodes. Key points: Docker = container runtime. Kubernetes = container orchestration tool. Kubernetes provides auto...
In this session, we learn how to monitor a Kubernetes cluster using Prometheus and Grafana.This is not just theory — there is a GitHub repository containing all installation commands and demo steps.The repo will also be enhanced later with advanced K...
1. What is a ConfigMap in Kubernetes? A ConfigMap is used to store non-sensitive configuration data that your application needs — such as: Database port Connection type Any general configuration values In normal applications (non-Kubernetes), de...
Kubernetes normally supports built-in resources like: Deployment Service Pod ConfigMap Secret Ingress These are called native resources. Sometimes companies (Istio, ArgoCD, Prometheus Operator, Kyverno, etc.) want to add new features that Kub...
1. Why Kubernetes Services Are Needed When a Pod is created in Kubernetes, it receives a dynamic IP address.If the Pod dies and restarts, its IP changes.So other Pods (like checkout → payments) cannot rely on Pod IP because it changes, creating issue...
Prometheus
Prometheus monitoring solution is a free and open-source solution for monitoring metrics, events, and alerts. It collects and records metrics from servers, containers, and applications. In addition to providing a flexible query language (PromQL), and powerful visualization tools, it also provides an alerting mechanism that sends notifications when needed.
Node Exporter
Node Exporter is a Prometheus exporter for hardware and OS metrics. It is designed to run on each node (e.g., an EC2 instance, server, or container) to expose metrics about the system’s performance.
Grafana
Grafana is an open-source platform for monitoring and observability, focused on providing visualization and dashboards for data from various sources, including Prometheus.
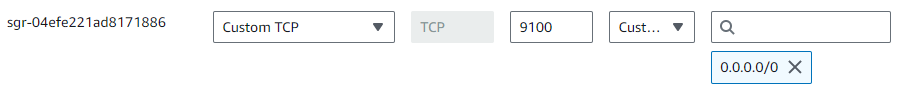
Add security group for EC2 instances:


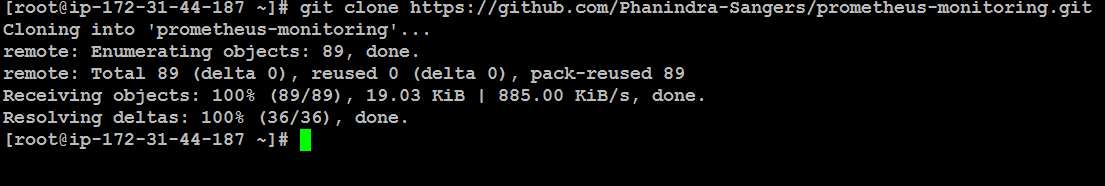
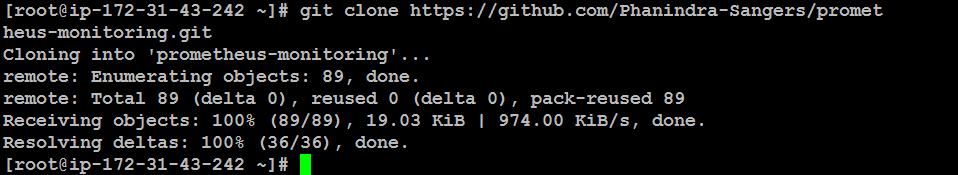
Step 1 : Installing Prometheus
git clone https://github.com/Phanindra-Sangers/prometheus-monitoring.git
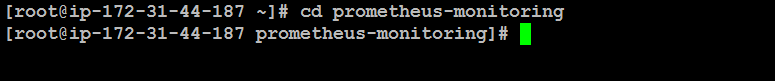
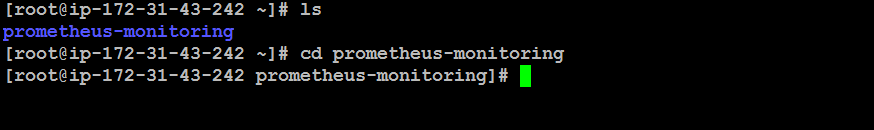
cd prometheus-monitoring
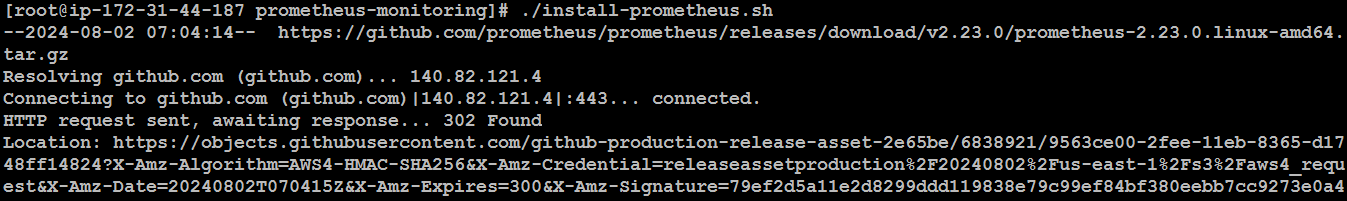
Install prometheus service
./install-prometheus.sh
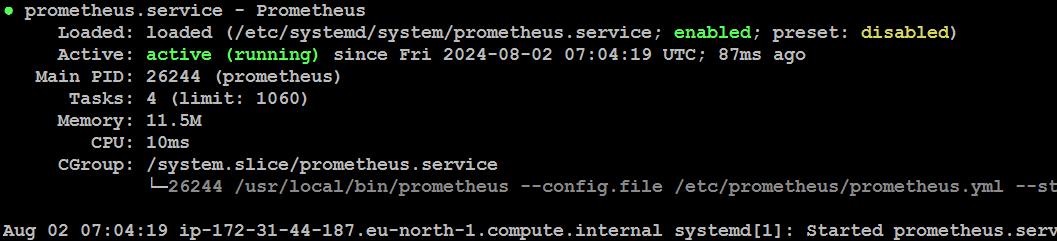
Now, Prometheus service is running
Creates a new user and add new directories for Prometheus
sudo useradd --no-create-home prometheus
sudo mkdir /etc/prometheus
sudo mkdir /var/lib/prometheus
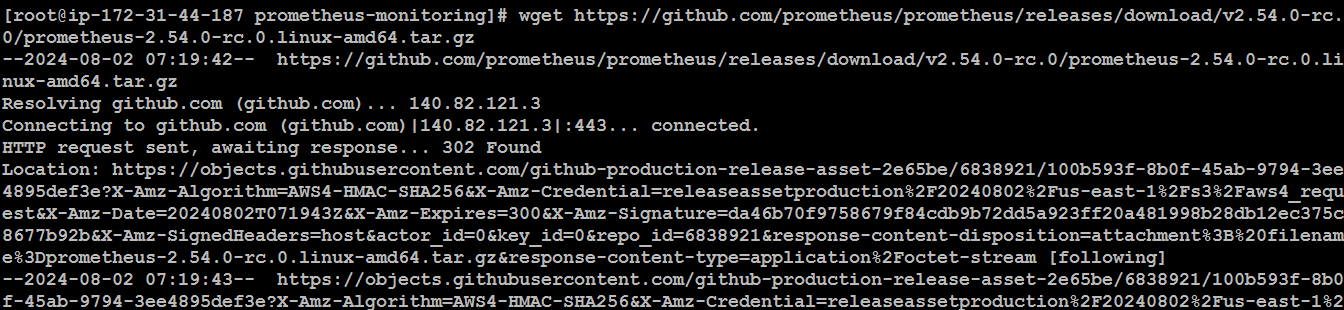
Downloads the Prometheus, extract it and put it in /usr/local/bin folder and finally delete the software
wget https://github.com/prometheus/prometheus/releases/download/v2.54.0-rc.0/prometheus-2.54.0-rc.0.linux-amd64.tar.gz
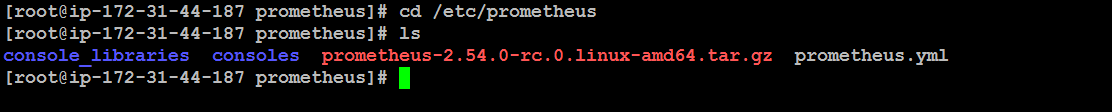
sudo cp -r prometheus-2.54.0-rc.0.linux-amd64.tar.gz /etc/prometheus

tar -xvf prometheus-2.54.0-rc.0.linux-amd64.tar.gz
sudo cp prometheus-2.54.0-rc.0.linux-amd64/prometheus /usr/local/bin
sudo cp prometheus-2.54.0-rc.0.linux-amd64/promtool /usr/local/bin

rm -rf prometheus-2.23.0.linux-amd64.tar.gz prometheus-2.19.0.linux-amd64

Configure Prometheus :
Create a prometheus.yml file at "/etc/prometheus/prometheus.yml" with the below content
cd /etc/prometheus
vi prometheus.yml
Copy the following content in yml file.
global:
  scrape_interval: 15s
  external_labels:
    monitor: 'prometheus'

scrape_configs:
  - job_name: 'prometheus'
    static_configs:
      - targets: ['localhost:9090']
Now we want to run the Prometheus as a Service so that in case of server restart service will come automatically
Create a file at "/etc/systemd/system/"
cd /etc/systemd/system/

vi prometheus.service
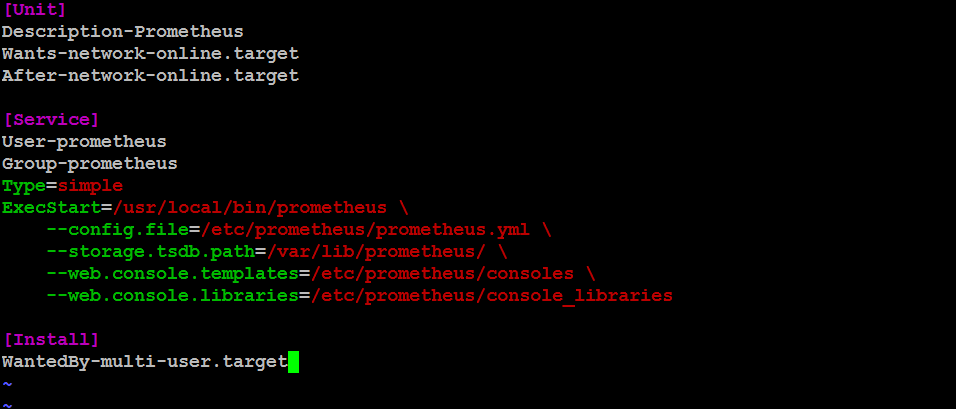
Copy the below content in the service file
[Unit]
Description-Prometheus
Wants-network-online.target
After-network-online.target

[Service]
User-prometheus
Group-prometheus
Type=simple
ExecStart=/usr/local/bin/prometheus \
    --config.file=/etc/prometheus/prometheus.yml \
    --storage.tsdb.path=/var/lib/prometheus/ \
    --web.console.templates=/etc/prometheus/consoles \
    --web.console.libraries=/etc/prometheus/console_libraries

[Install]
WantedBy-multi-user.target
Save and exit "Press esc :wq"
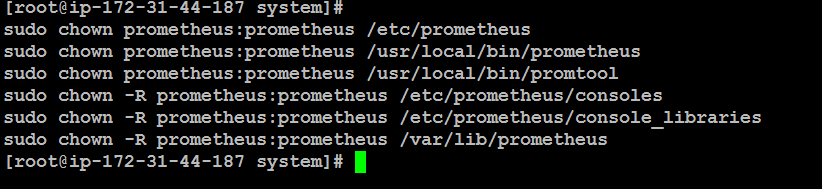
Change the ownership of all folders and files which we have created to the user which we have created in the first step
sudo chown prometheus:prometheus /etc/prometheus
sudo chown prometheus:prometheus /usr/local/bin/prometheus
sudo chown prometheus:prometheus /usr/local/bin/promtool
sudo chown -R prometheus:prometheus /etc/prometheus/consoles
sudo chown -R prometheus:prometheus /etc/prometheus/console_libraries
sudo chown -R prometheus:prometheus /var/lib/prometheus
Configure the service and start it
sudo systemctl daemon-reload
sudo systemctl enable prometheus
sudo systemctl start prometheus
sudo systemctl status prometheus
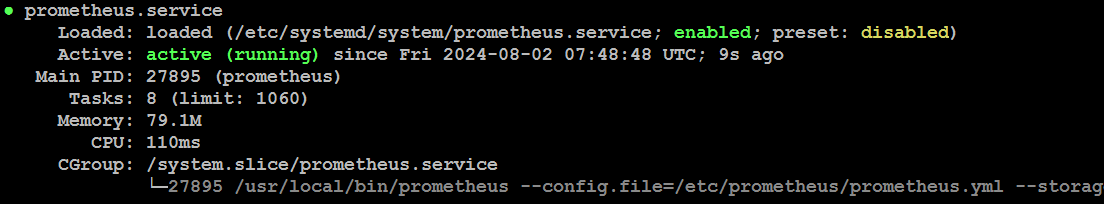
Now, Prometheus service is running
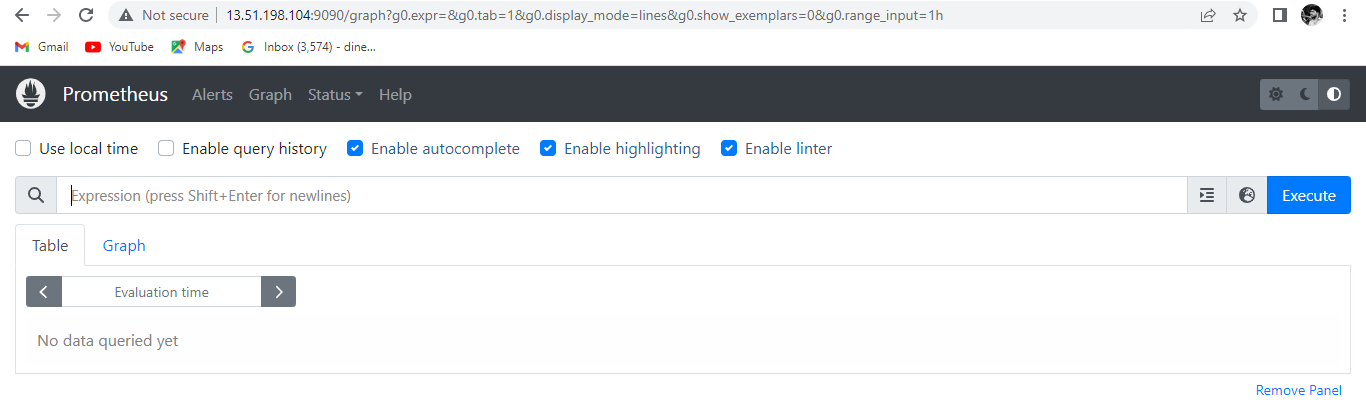
Now we can access the Prometheus dashboard
http://<public ip>:9090
Step 2 : Install Node Exporter
To monitor your servers you need to install the node exporter on all your target machine which is like a monitoring agent on all the servers.
git clone https://github.com/Phanindra-Sangers/prometheus-monitoring.git
cd prometheus-monitoring
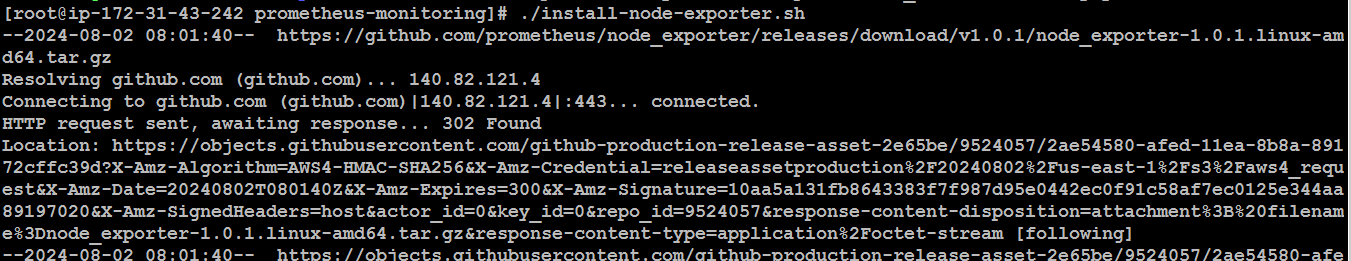
./install-node-exporter.sh
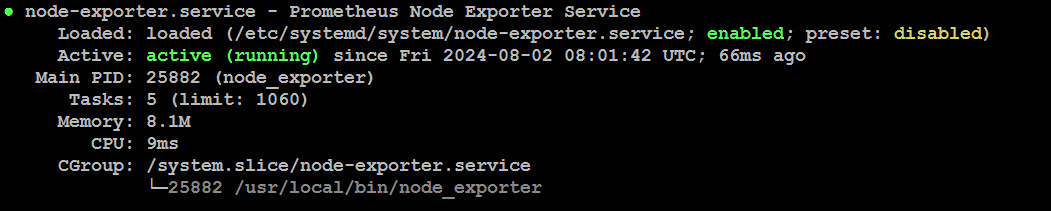
Now, Node exporter service is running
sudo useradd --no-create-home node_exporter

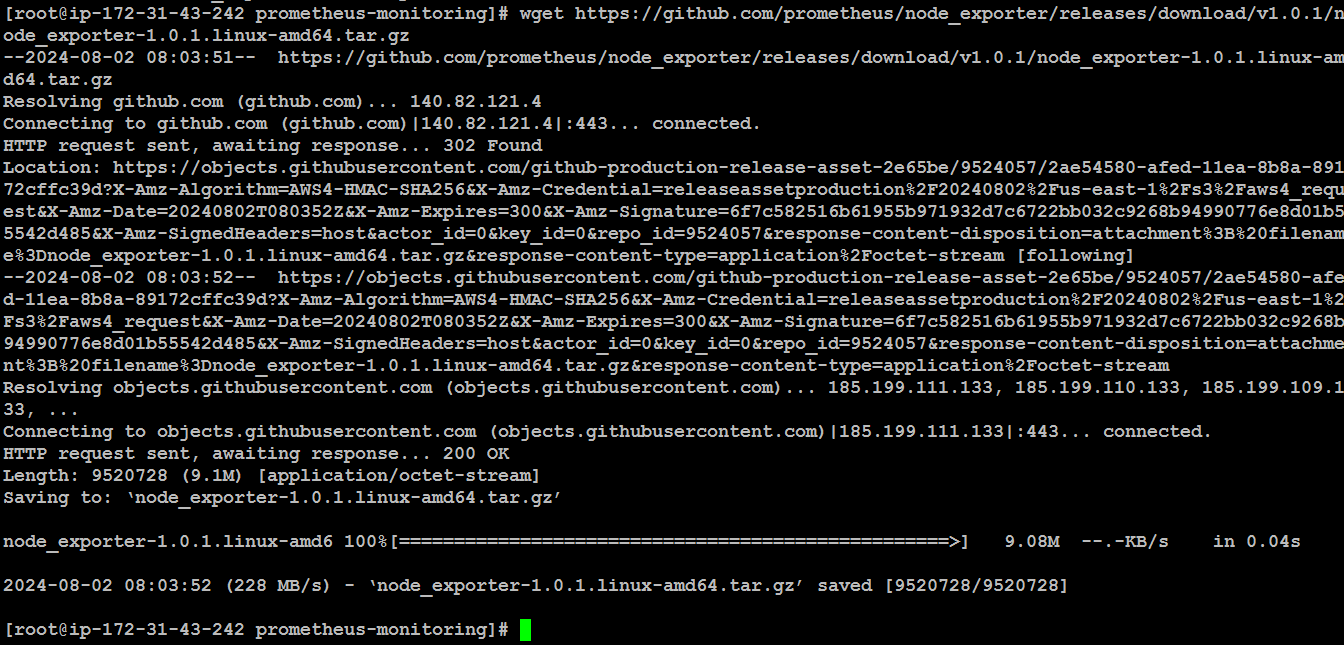
wget https://github.com/prometheus/node_exporter/releases/download/v1.0.1/node_exporter-1.0.1.linux-amd64.tar.gz
tar xzf node_exporter-1.0.1.linux-amd64.tar.gz
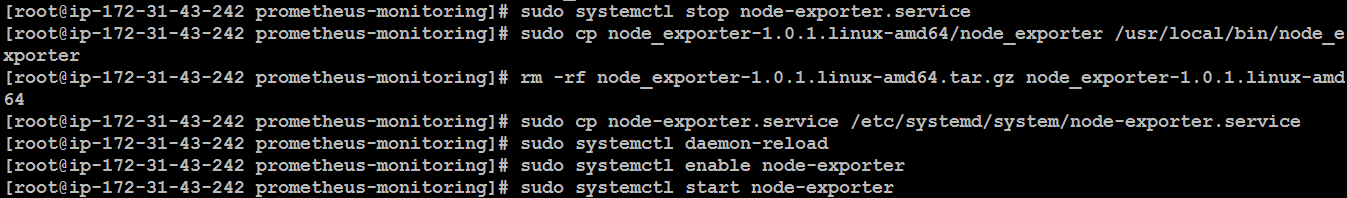
sudo cp node_exporter-1.0.1.linux-amd64/node_exporter /usr/local/bin/node_exporter
rm -rf node_exporter-1.0.1.linux-amd64.tar.gz node_exporter-1.0.1.linux-amd64
sudo cp node-exporter.service /etc/systemd/system/node-exporter.service
sudo systemctl daemon-reload
sudo systemctl enable node-exporter
sudo systemctl start node-exporter
sudo systemctl status node-exporter
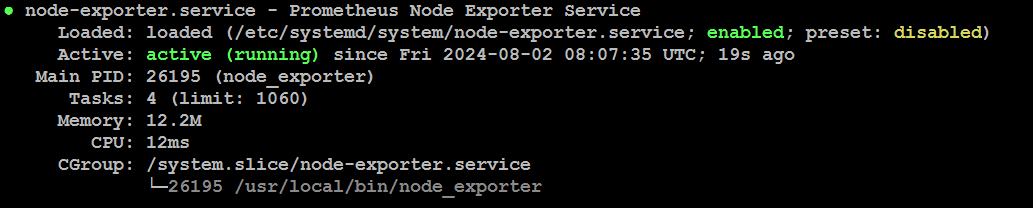
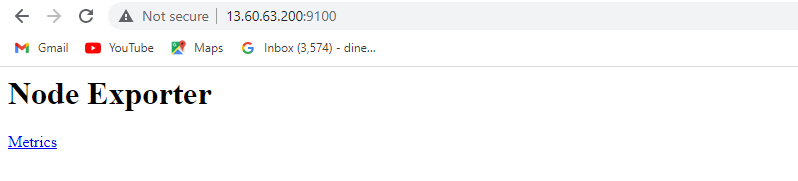
Now we can access the "Node Exporter" dashboard
Step 3: Configure Prometheus for the Nodes
Now we will configure the Prometheus for our EC2 instance where we have installed the node-exporter.
Login to the Prometheus server and edit the file file at location in Prometheus instance
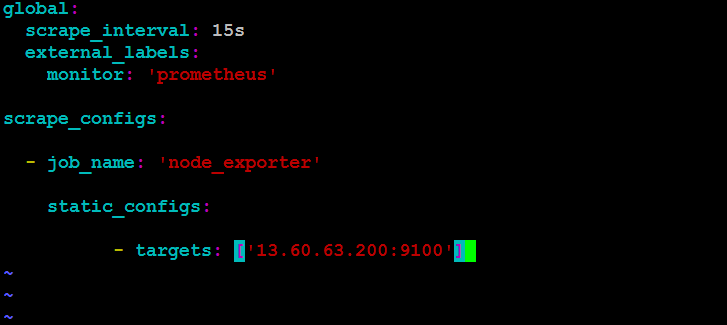
vi /etc/prometheus/prometheus.yml
Need to add Node Exporter machine ip with port
global:
  scrape_interval: 15s
  external_labels:
    monitor: 'prometheus'

scrape_configs:

  - job_name: 'node_exporter'
    static_configs:
          - targets: ['13.60.63.200:9100']
Restart the Prometheus service & Check the Prometheus service status
sudo systemctl restart prometheus
sudo systemctl status prometheus
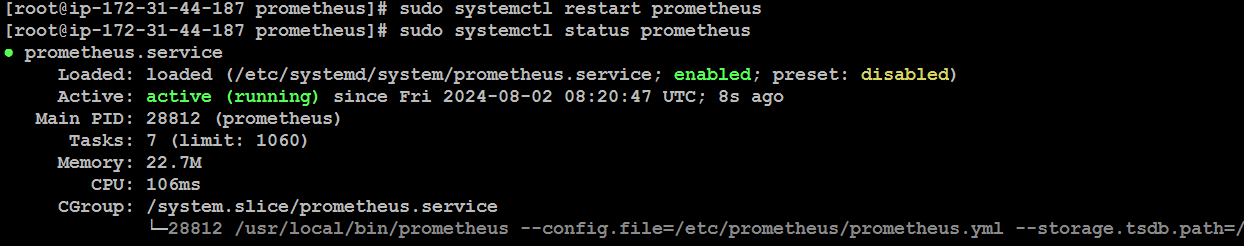
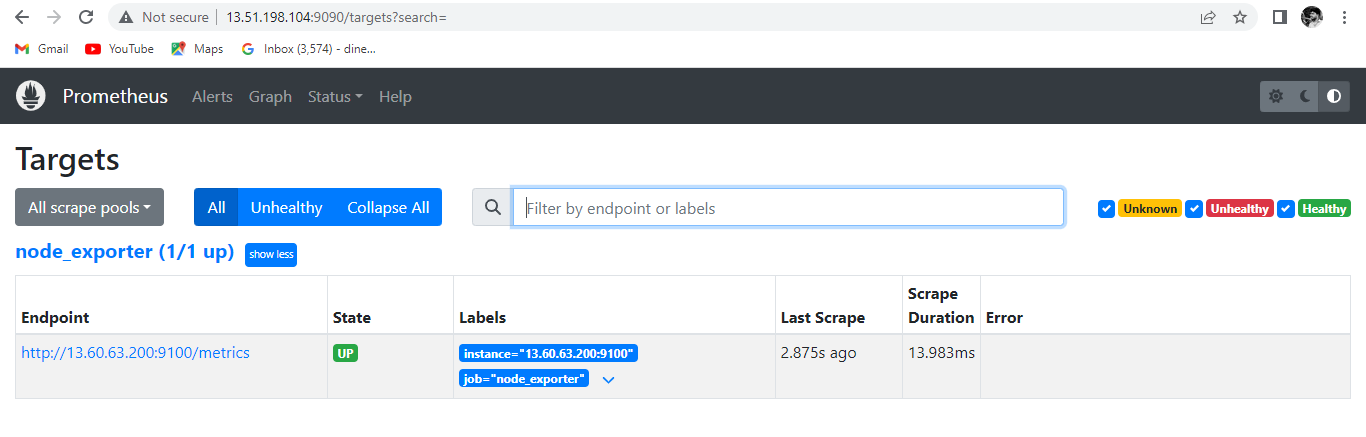
Now you can open the Prometheus using below url and can see the new targets added
http://<ip address>:9090/targets
Step 4: Install Grafana
Once Prometheus is installed successfully then we can install the Grafana and configure Prometheus as a datasource.
Grafana is an opensource tool which is used to provide the visualization of your metrics
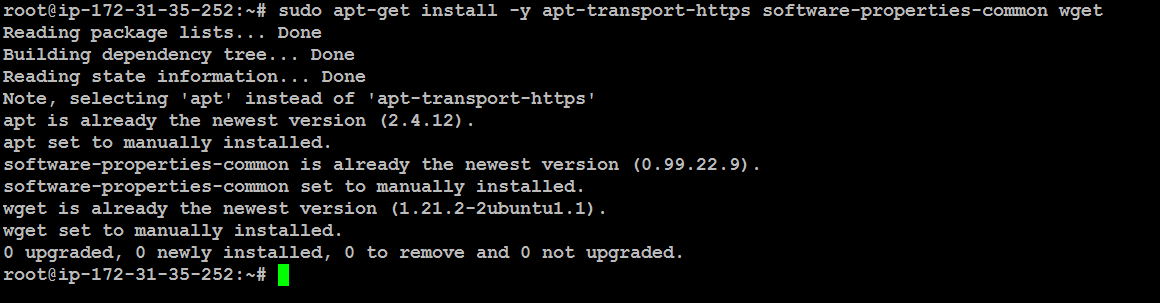
Install the prerequisite packages:
sudo apt-get install -y apt-transport-https software-properties-common wget
Import the GPG key:
sudo mkdir -p /etc/apt/keyrings/
wget -q -O - https://apt.grafana.com/gpg.key | gpg --dearmor | sudo tee /etc/apt/keyrings/grafana.gpg > /dev/null


To add a repository for stable releases, run the following command:
echo "deb [signed-by=/etc/apt/keyrings/grafana.gpg] https://apt.grafana.com stable main" | sudo tee -a /etc/apt/sources.list.d/grafana.list

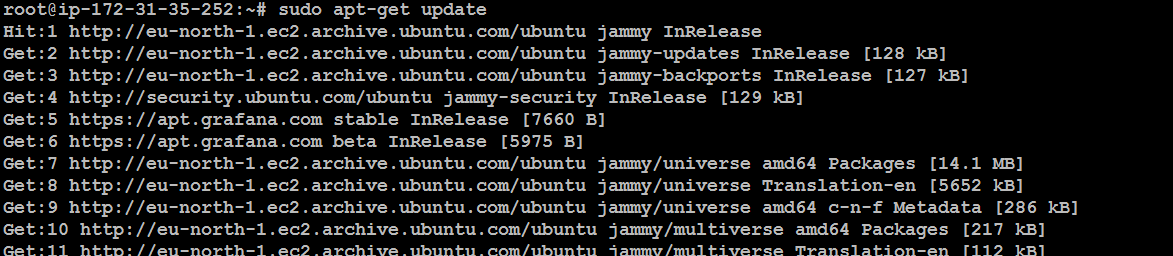
Update the list of available packages:
sudo apt-get update
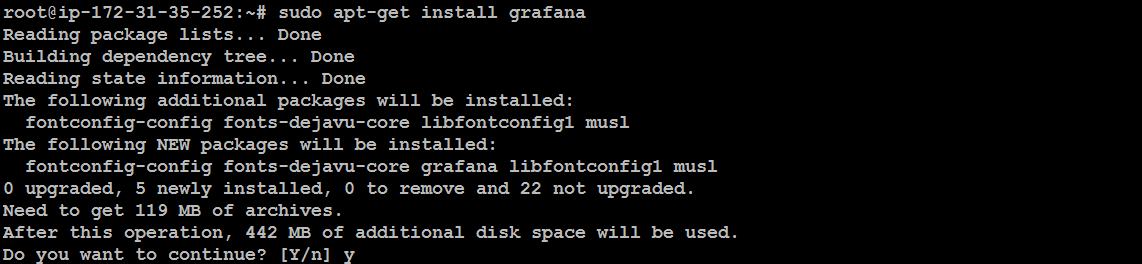
To install Grafana, run the following command:
sudo apt-get install grafana
To start the service, run the following commands:
sudo systemctl daemon-reload
sudo systemctl start grafana-server

Check the grafana server status
sudo systemctl status grafana-server
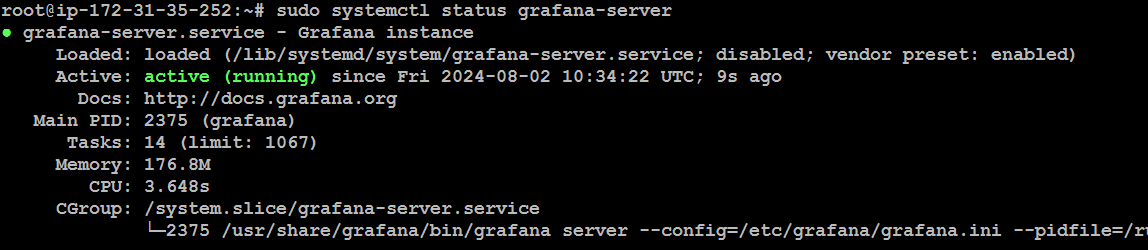
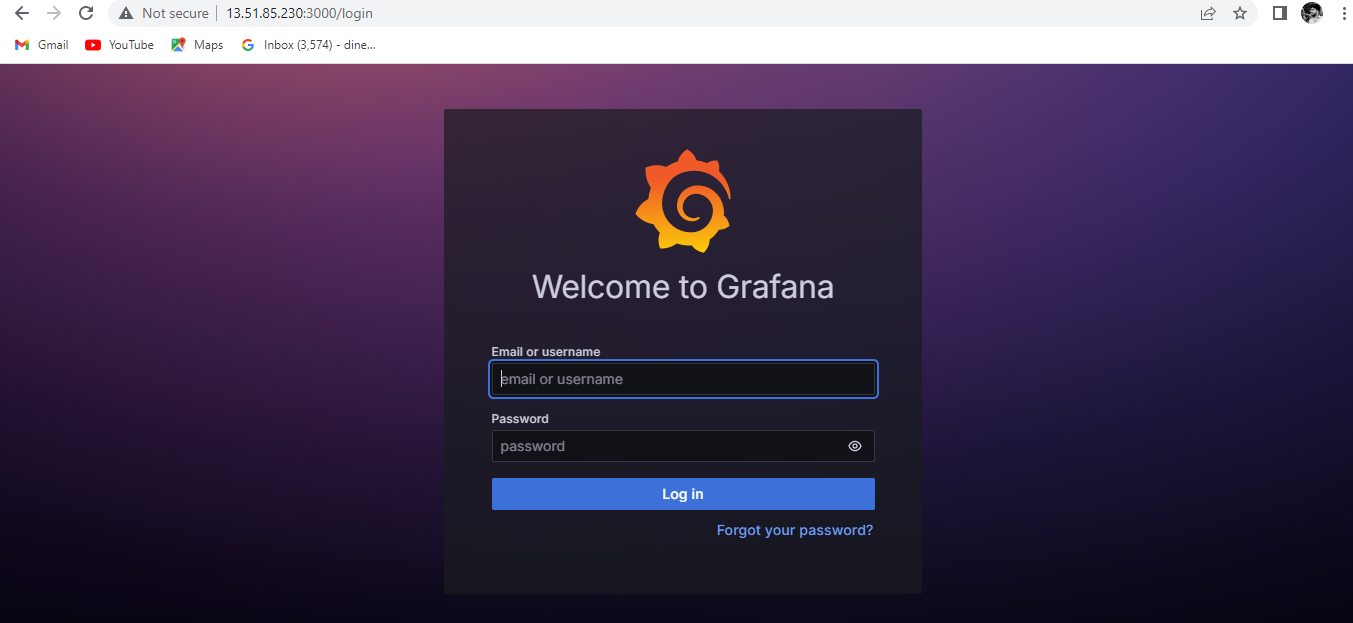
Now, we can access Grafana dashboard
http://<ip address>:3000
Login with default Username : admin & default password : admin
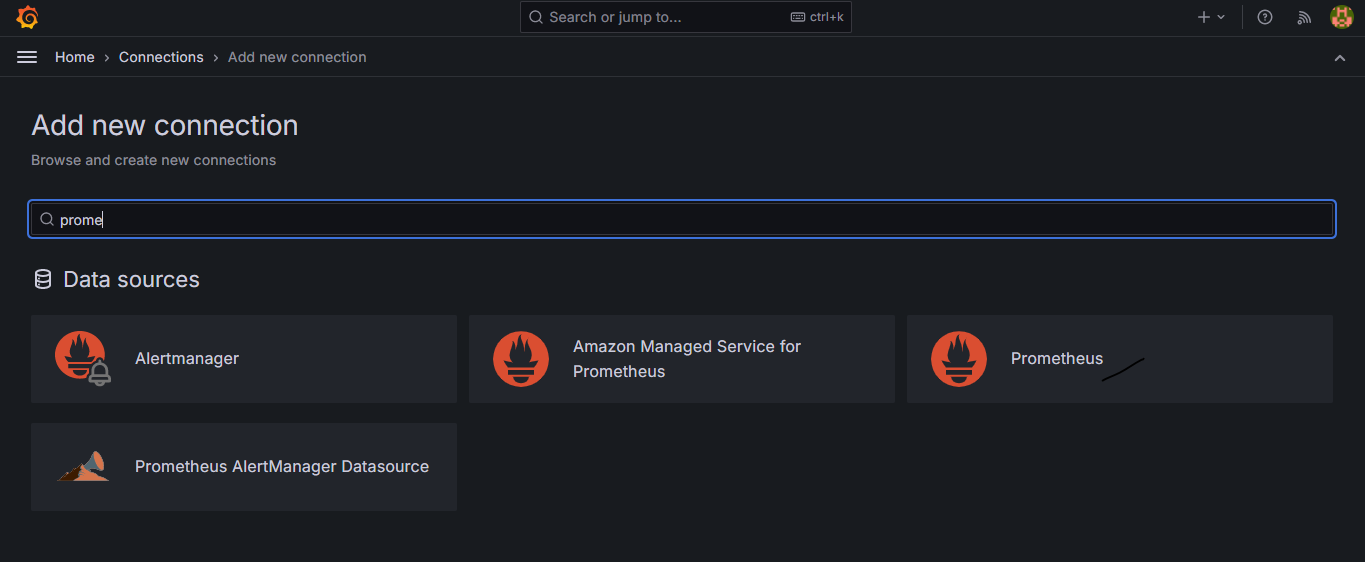
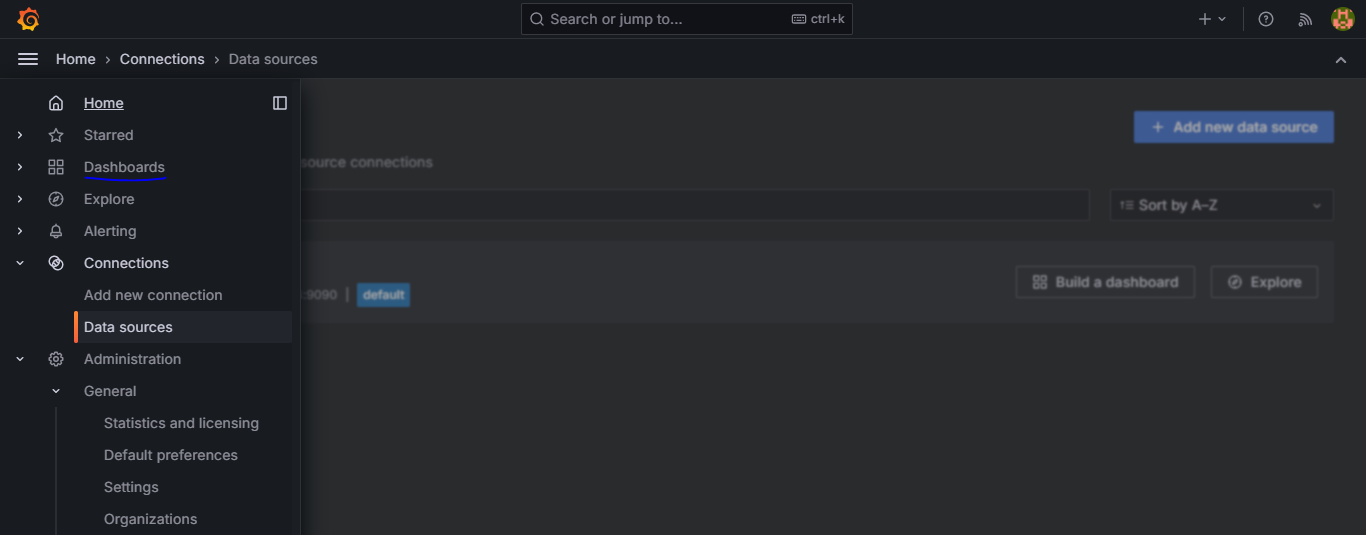
Click on "Connections", Click "Add new connection"
Search ( Prometheus ) & Click "Prometheus"
Click "Add new data source"
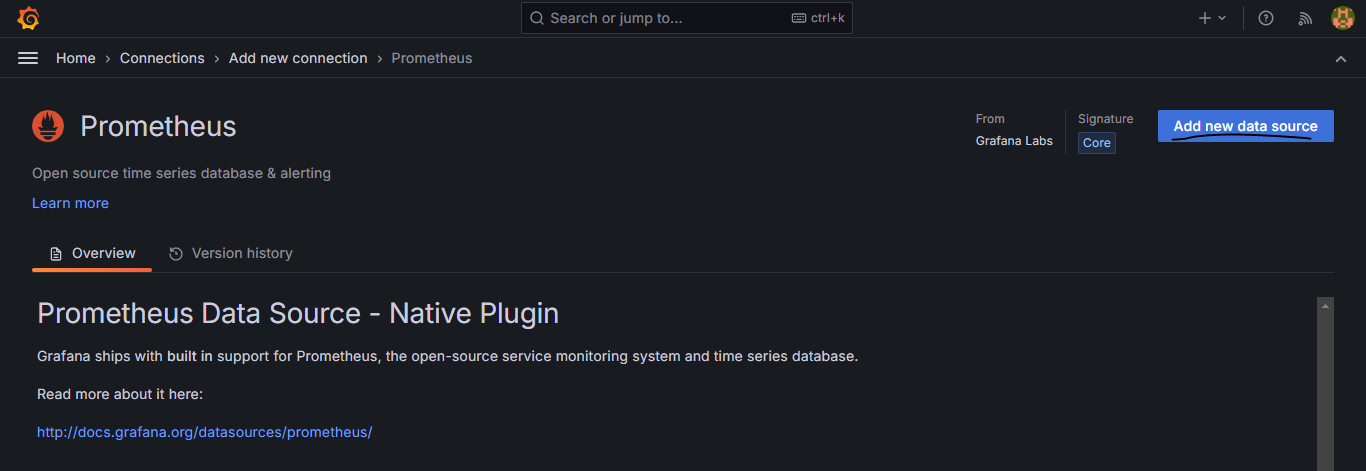
Enter the name "Prometheus"
Mention your Prometheus server ip "http://<ip address>:9090"
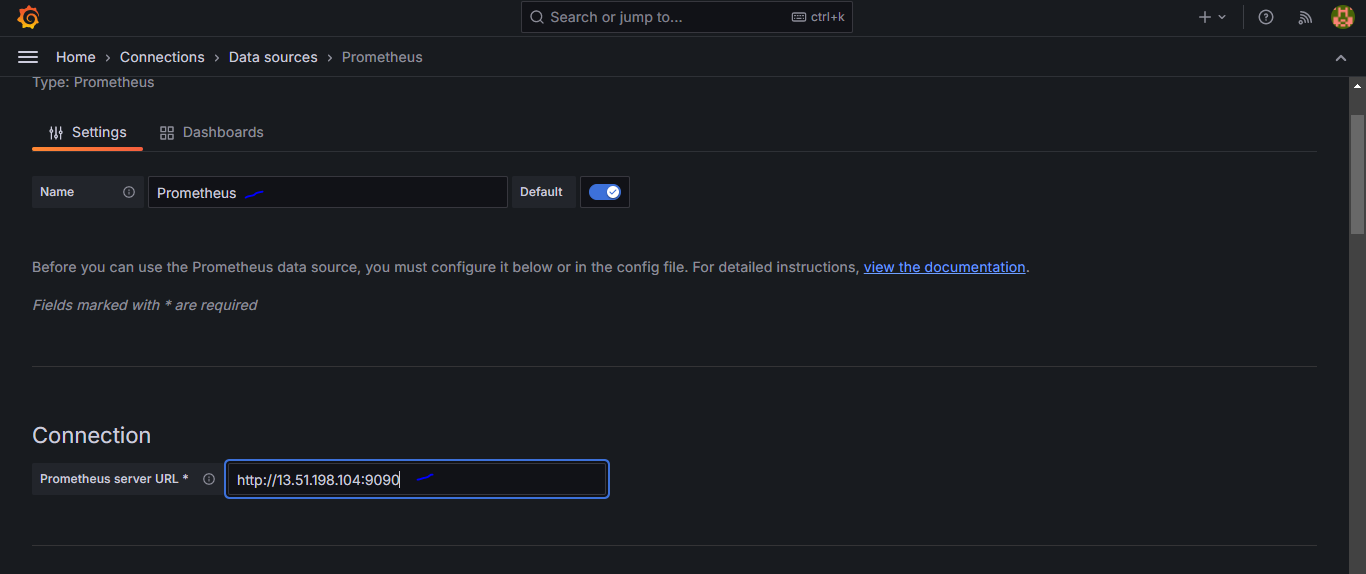
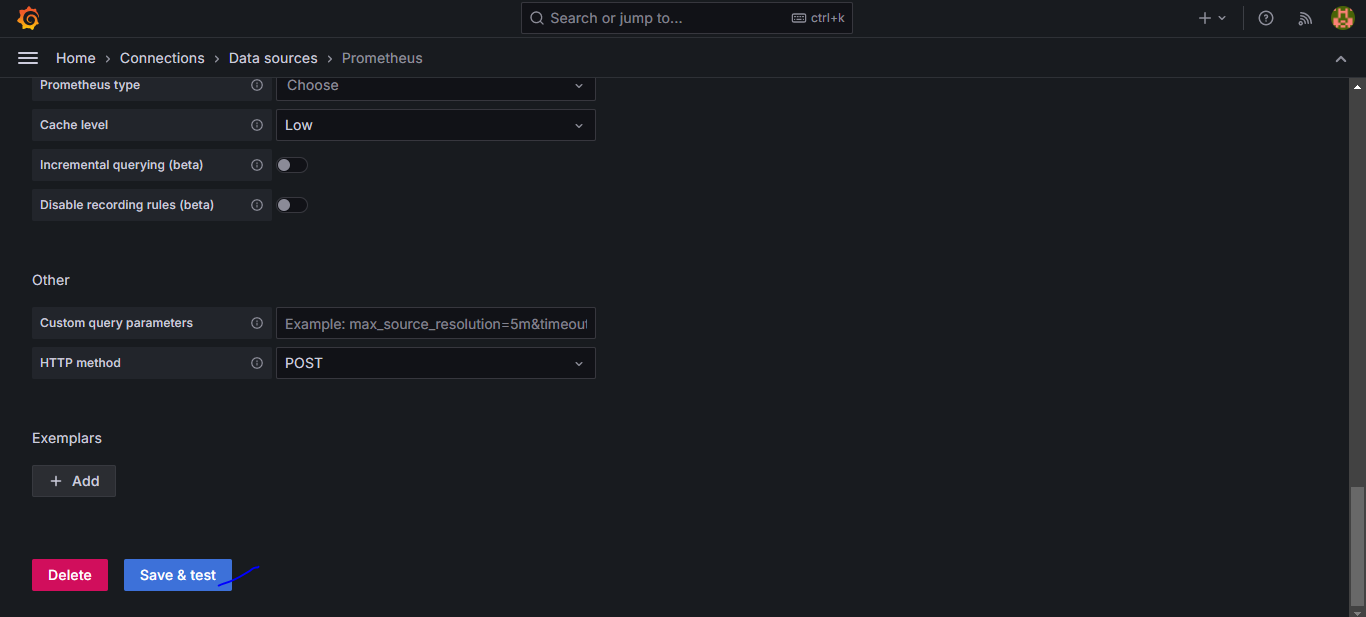
Scroll down, Click "Save & test"
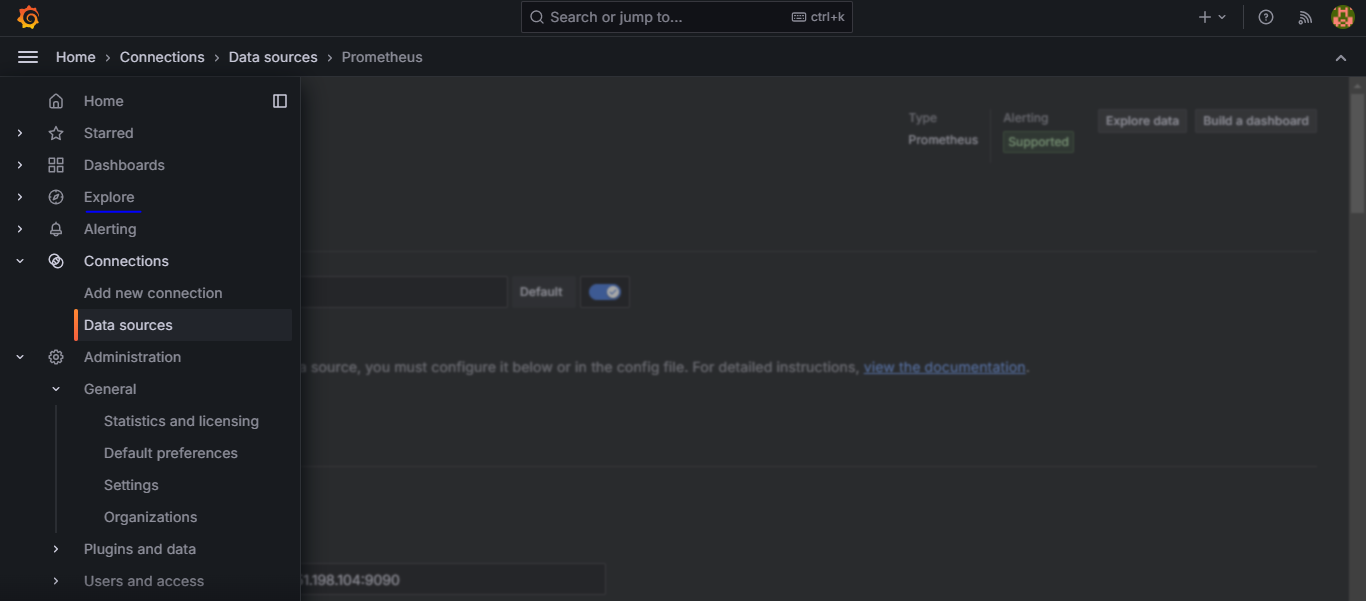
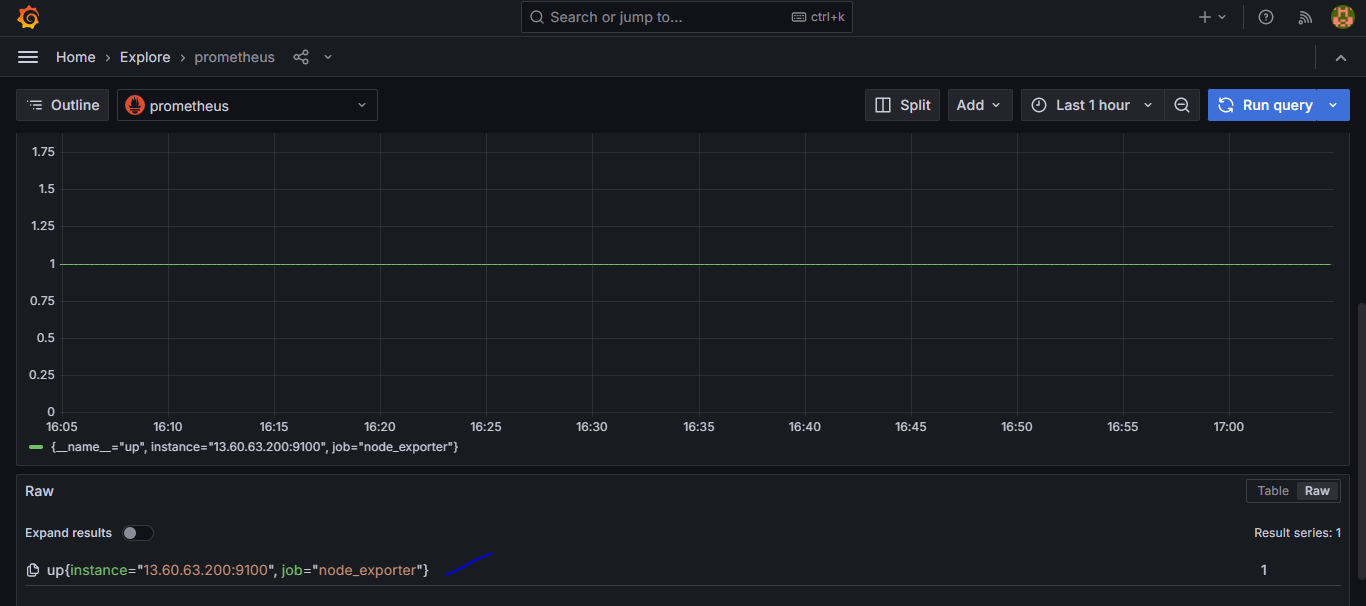
Click on "Data source"
Choose "prometheus" and Enter "up" query in Metric Browser
Press the "Run query" option
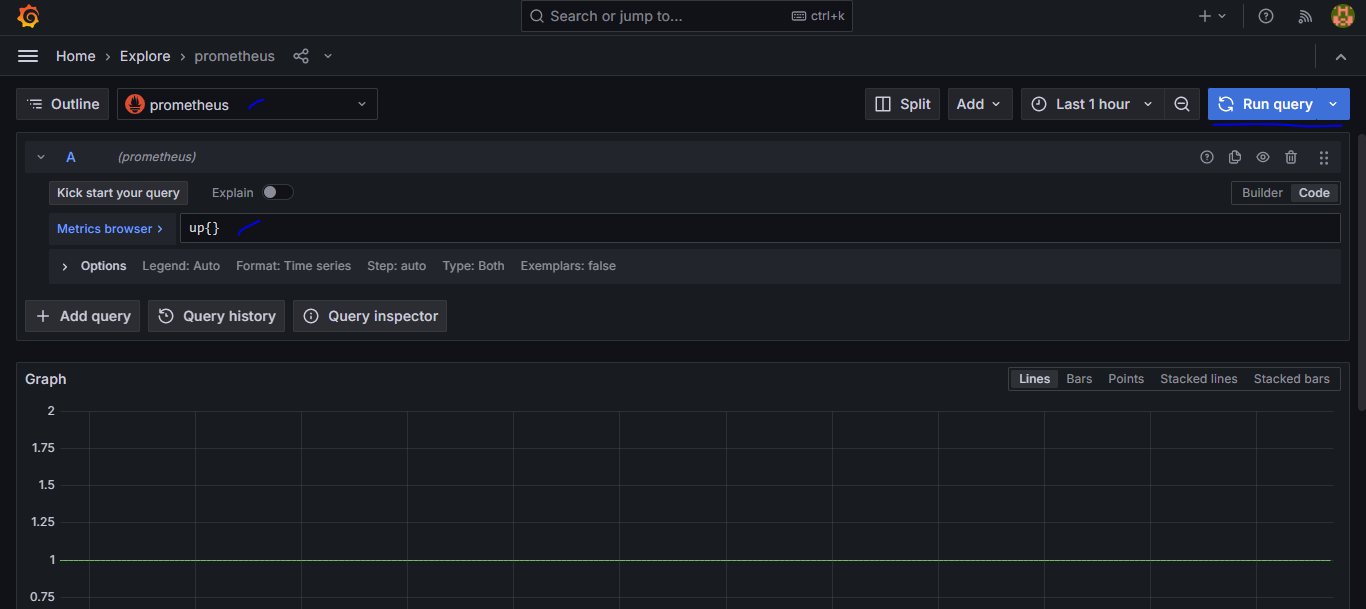
You will get dashboard
Grafana provides lot of dashboards which we can directly import in our Grafana instance and use it.
Import the dashboard
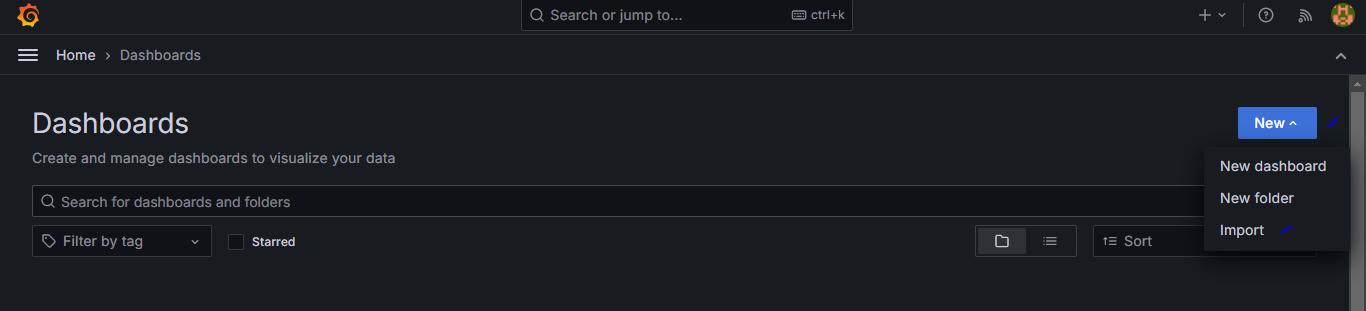
Click on Dashboards
Click on new, Click Import
I have downloaded sample "Dashboard JSON file"
Click on "Upload dashboard JSON file"
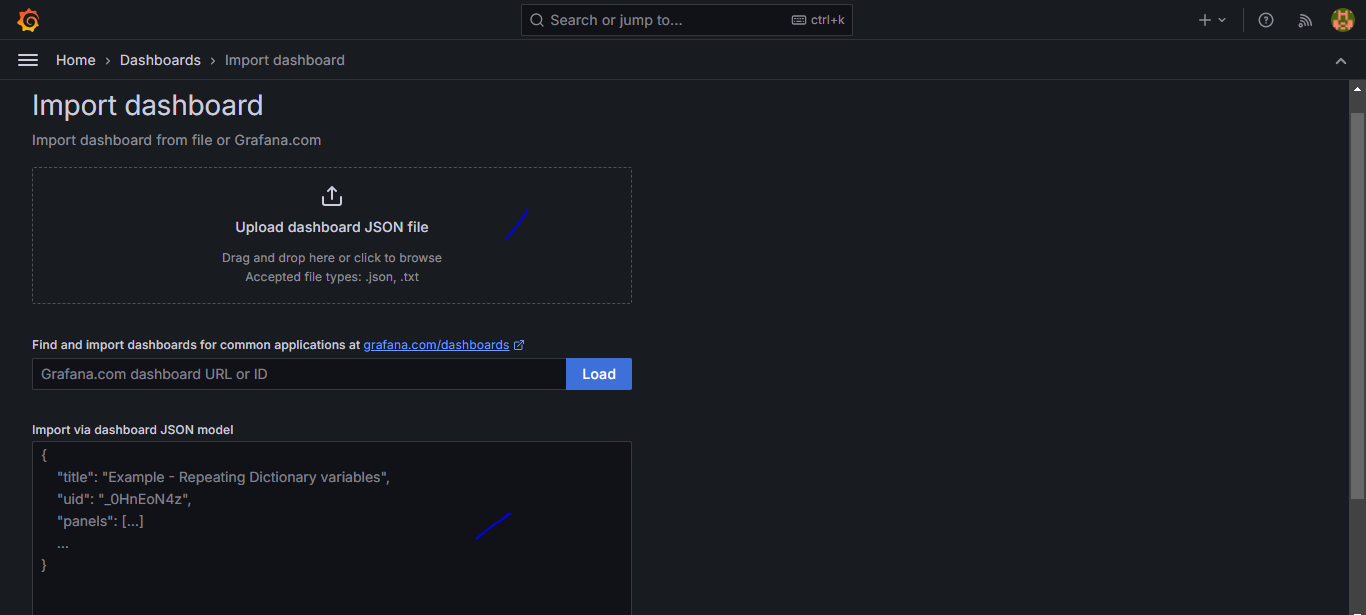
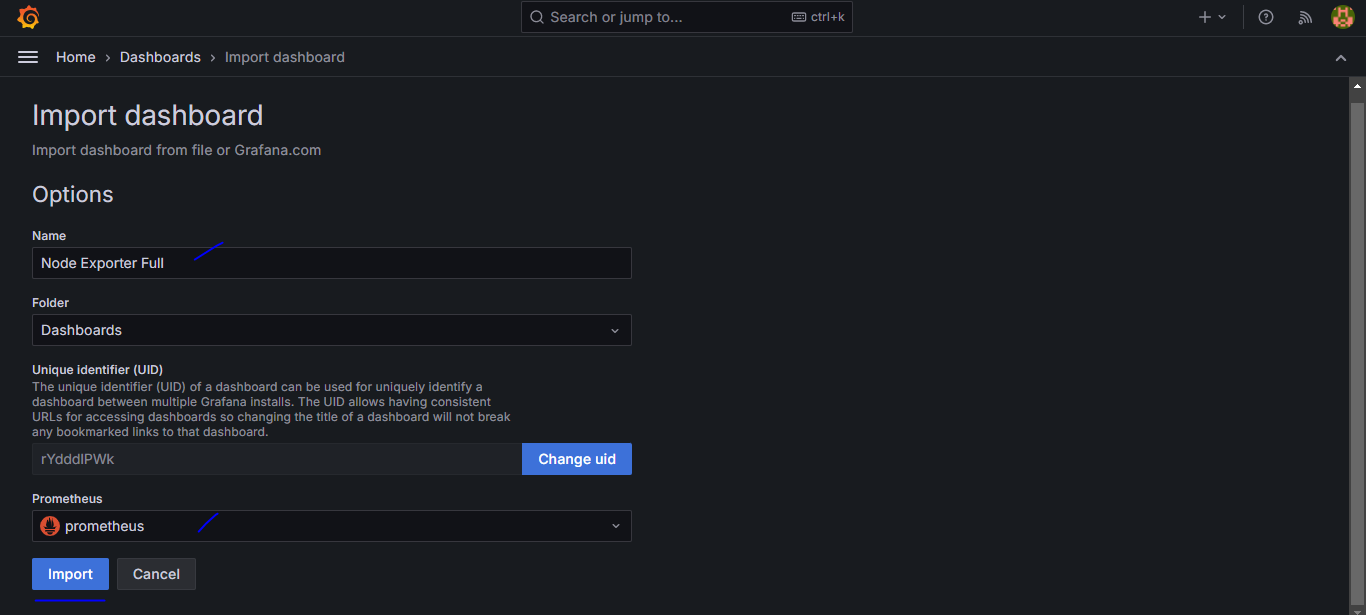
Set name for "Dashboard" and Select "Prometheus"
Click "Import"
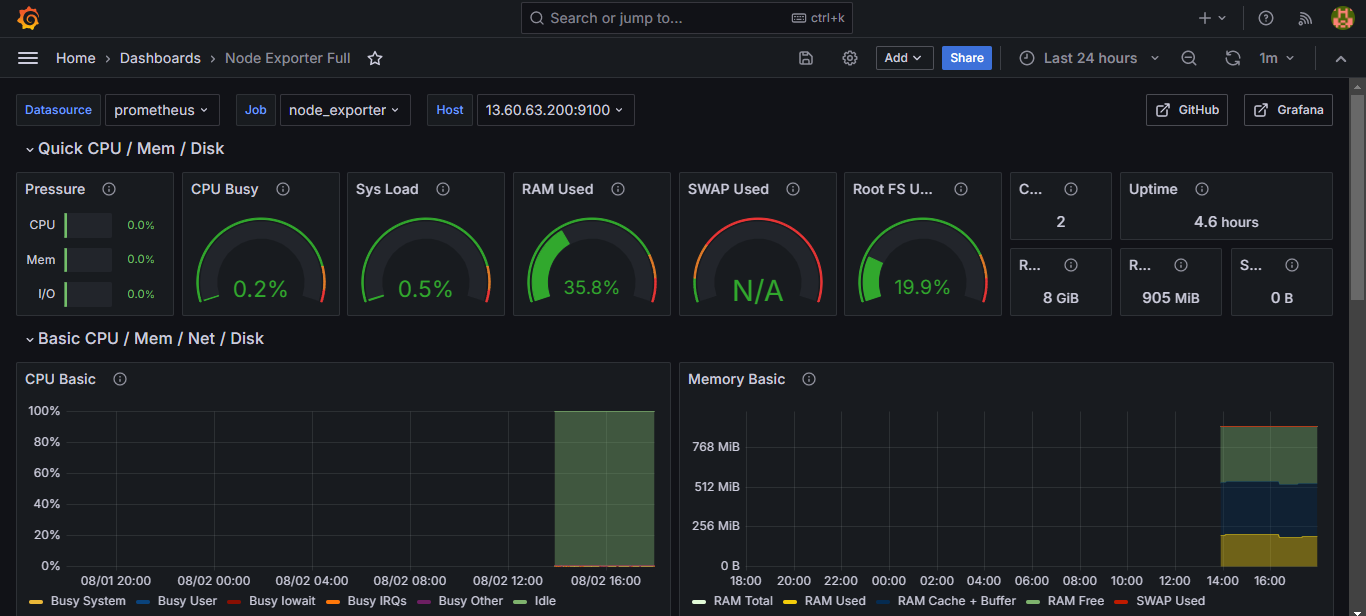
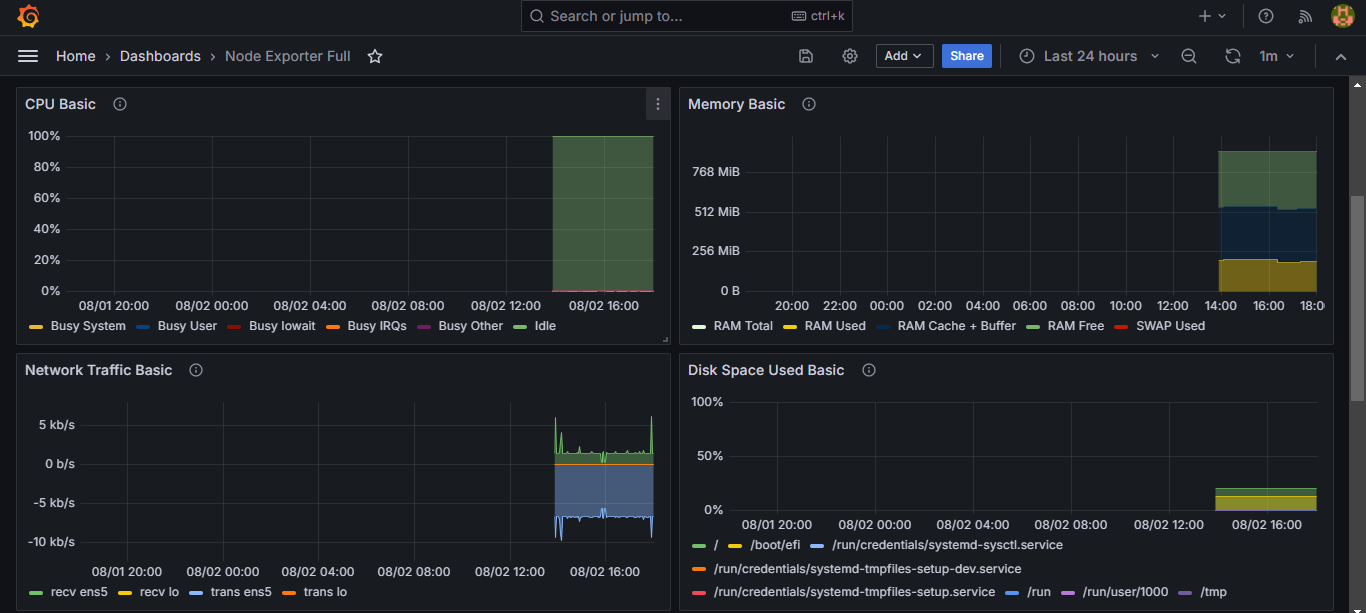
Now, we can see the EC2 instance metrics include CPU, Memory, Network, and more in the Grafana Dashboard.